What symptom started your renovation planning?
The symptom decides which scope to price first.
No votes yet. Yours will be the first. · saved on this device
Loading...
Pool Renewal Notes · Statistics
132 sourced data points on pool renovation: what projects cost, what they return at resale, what homeowners choose, how many U.S. homes already have each feature by region, and 1 finding from Pool Renewal Notes's own analysis of federal household data. Every number links to where it came from.
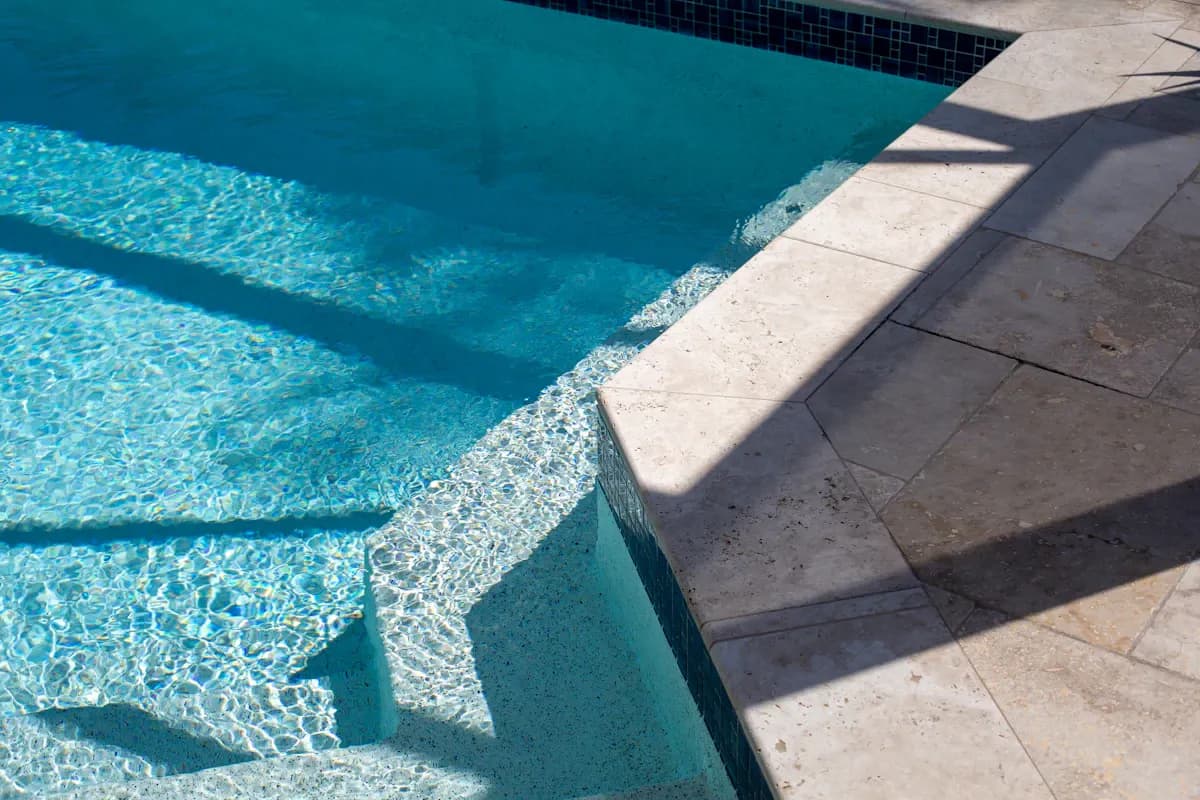
Photo: Brianna Lengacher · License.
These comparisons were calculated by Pool Renewal Notes from the Energy Information Administration's 2024 household survey microdata and the Census Bureau's new-housing tables. They answer questions the published reports don't break out.
Pool Renewal Notes analysis · 2024
95% interval 65.6%–72.6% · about 6.3 million homes · 1,222 survey households
Most hot tubs sit on their own, not beside a pool. A stand-alone spa pad with its own electrical run is the common project, and it doesn't need to be priced as a pool package.
Source: Pool Renewal Notes analysis of 2024 federal household survey data from the U.S. Energy Information Administration. How we calculated it
$10,482 A U.S. pool remodel averages $10,482, with a range of $1,600 to $30,000
Angi's cost guide, updated August 2026, is the benchmark behind this site. It is a broad range that mixes project sizes and repair scopes; a new surface, structural repair or reshaped pool needs its own diagnosis and quote.
Angi, Pool Remodel Cost (2026)$11,000 Pool resurfacing averages $11,000; most projects land between $6,000 and $15,000
HomeAdvisor's 2026 guide shows resurfacing can run from $1,000 for paint on a small pool to $50,000 for a full tile interior. Size, the finish you choose and how much prep the old shell needs drive the final number.
HomeAdvisor, Pool Resurfacing Cost (2026)$5,500 per 1,000 sq ft Plaster costs ~$5,500 per 1,000 sq ft; aggregate $6,500; tile up to $30,000
HomeAdvisor's per-finish pricing shows why most homeowners land on plaster or a pebble/quartz aggregate. Tile is five to six times the cost but is the longest-lasting interior.
HomeAdvisor, Pool Resurfacing Cost (2026)$45–$65 per hour Resurfacing labor is $45–$65 an hour; draining adds $175–$225 before the job
HomeAdvisor's 2026 breakdown also lists a $250 average pre-resurfacing cleaning. Drain, refill and water-balancing costs are easy to forget when comparing resurfacing bids.
HomeAdvisor, Pool Resurfacing Cost (2026)$3,500–$6,500 Replaster costs $3,500–$6,500; quartz $7k–$10k; pebble $6k–$15k; tile $15k–$30k
Shasta Pools' January 2026 renovation guide prices each interior finish for a typical residential pool and notes labor is roughly half of tile jobs. Pebble finishes have become the mid-market default for longevity.
Shasta Pools, Cost to Replace Your Pool Tile, Deck or Interior Finish (2026)$5,000–$10,000 Basic plaster resurfacing runs $5,000–$10,000; pebble $9,000–$20,000+
Swimply's June 2026 guide also prices quartz aggregate at $7,000–$15,000, tile at $20,000–$50,000+, a fiberglass recoat at $6,000–$15,000 and paint or epoxy at $1,500–$5,000 with a shorter life. Swimply is a pool-rental marketplace, not a contractor.
Swimply, Pool Resurfacing Cost: The 2026 Guide$6,000–$15,000 Resurfacing a medium pool costs $6,000–$15,000; small $4,000–$8,000; large $10,000–$25,000+
Swimply's 2026 size bands are for basic resurfacing. Size matters because the finish is priced by interior area, while draining, mobilization and startup stay roughly fixed.
Swimply, Pool Resurfacing Cost: The 2026 Guide$250–$2,500 Resurfacing permits run $250–$2,500; draining and refilling $40–$2,000; crack repair about $75 per linear foot
Swimply's 2026 guide ties the permit range to location and the drain-and-refill range to pool size and local rates, and calls fall the best season to book, with winter also good in warm regions because contractors are less busy.
Swimply, Pool Resurfacing Cost: The 2026 Guide$1,500–$3,500 Automatic pool controls cost $1,500–$3,500; covers $1,000–$20,000; reshaping $50,000–$100,000
Anthony Sylvan Pools' guide, updated November 2025, prices manual covers at $1,000–$4,000 and automatic covers at $8,000–$20,000, a salt generator conversion at $1,000–$2,500 and an acid wash at $150–$300, puts labor at roughly 40% of a remodel and the timeline at 4–8 weeks. Anthony Sylvan sells remodels.
Anthony Sylvan Pools, Pool Remodel Cost (2025)Every 10–15 years Concrete pools need resurfacing every 10–15 years at $10,000–$20,000 each time
River Pools' 2025 ownership-cost guide (a fiberglass builder) contrasts this with vinyl liners needing replacement every 5–10 years at roughly $6,000–$10,000. Resurfacing is the largest recurring cost of owning a concrete pool.
River Pools and Spas, How Much Do Inground Pools Cost in 2025$2,588 Liner replacement averages $2,588; in-ground liners $1,200–$2,100 plus labor
HomeAdvisor's 2026 guide says upgrading from a 20-mil to a 28-mil liner adds $300–$500, and a well-kept liner can last 15–20 years. Small repairs run from $100–$250 for wrinkles to $100–$2,500 for leaks.
HomeAdvisor, Pool Liner Replacement Cost (2026)5–10 years Vinyl liners last 5–10 years; a well-kept 20-mil liner can reach 10–12 years
Bob Vila's 2024 guide puts liner replacement at $1,125–$3,688 (average $2,393) with in-ground labor of $1,000–$2,500, and a 28-mil heavy-use liner averaging $1,700. Water chemistry and sun exposure decide where in the range your liner lands.
Bob Vila, Pool Liner Replacement Cost (2024)$3,000–$20,000 Pool tile installation costs $3,000–$20,000; glass tile runs $7–$50 per sq ft
HomeAdvisor's 2026 guide lists labor at $4–$32 per sq ft, demolition and prep at $500–$2,500, waterline replacement at about $25 per linear foot, and permits at $50–$300. Material choice, not labor, drives the top of the range.
HomeAdvisor, Pool Tile Installation Cost (2026)$25–$30 per linear foot Waterline tile runs $25–$30 per linear foot, or $1,500–$2,500 for a 10x20 pool
Shasta Pools' January 2026 guide puts a full tile replacement at roughly $15,000 on average (range $1,500–$80,000). Waterline-only retiling is the affordable fix for calcium scale and cracked tile.
Shasta Pools, Cost to Replace Your Pool Tile, Deck or Interior Finish (2026)$15–$60 per linear foot Waterline retiling costs $15–$60 per linear foot; full retile $20–$60 per sq ft
We Fix Ugly Pools' 2026 pricing puts a typical 60–100 linear foot waterline job at $1,200–$6,000 and a 500 sq ft full retile at $15,000–$30,000+. Labor alone is $20–$40 per sq ft depending on region.
We Fix Ugly Pools, Pool Tile Replacement Cost (2026)$30–$50 per linear foot Pool coping replacement costs $30–$50 per linear foot; re-grouting ~$3 per sq ft
Bob Vila's 2026 remodel guide also prices patching at $65 per linear foot and full step-wall replacement around $4,500. Coping is often replaced together with waterline tile because both sit at the bond beam.
Bob Vila, Pool Remodel Cost (2026)$10,483 A pool remodel averages $10,483 (typically $5,597–$15,775) and takes 4–8 weeks
Bob Vila's 2026 guide splits a remodel at about 55% materials and 45% labor, with full projects ranging from $1,600 to $30,000. Multi-scope remodels that add resurfacing, tile, deck and equipment together push past the average.
Bob Vila, Pool Remodel Cost (2026)$450–$1,700 LED pool lights add $450–$1,700 in a remodel; water features $450–$5,000
Bob Vila's 2026 remodel add-on list also prices skimmer replacement at $1,500–$3,000, saltwater conversion at $500–$2,500 and slides at $1,000–$15,000. Bundling upgrades while the pool is already drained saves on repeat drain-and-refill costs.
Bob Vila, Pool Remodel Cost (2026)$5,400–$13,500 Replacing a 900 sq ft pool deck costs $5,400–$13,500; resurfacing $3–$12/sq ft
Shasta Pools' 2026 guide prices demolition at $2–$6 per sq ft and new decking at $5–$15 for concrete, $15–$30 stamped, $20–$40 natural stone. Resurfacing an intact slab is often the best value in a remodel.
Shasta Pools, Cost to Replace Your Pool Tile, Deck or Interior Finish (2026)40–60% Resurfacing a pool deck instead of replacing it saves roughly 40–60%
SKIN Microplaster's May 2026 guide prices concrete overlays at $3–$6 per sq ft (10–15 year life), cool-deck finishes $6–$12, and stamped concrete $8–$15 (15–25 years). Most resurfacing jobs land at $3,000–$12,000.
SKIN Microplaster, Pool Deck Resurfacing Cost (2026)$3,094 Heater installation averages $3,094; gas units last 7–12 years, solar up to 30
HomeAdvisor's 2026 guide prices heat pumps at $2,500–$7,500, gas at $1,500–$6,000 and solar at $2,500–$9,500. If your gas heater is past ten years, a replacement is usually a better buy than another repair.
HomeAdvisor, Pool Heater Installation Cost (2026)$500–$2,500 Saltwater conversion costs $500–$2,500 and adds about $50 a year in electricity
HomeAdvisor's 2026 guide says a 20,000 gallon pool needs 10–12 forty-pound bags of salt at $10–$40 each to start. Salt is cheaper than chlorine over time, so overall chemical costs fall after the conversion.
HomeAdvisor, Saltwater Pool Cost (2026)$1,500–$2,500 A salt chlorine generator costs $1,500–$2,500; replacement cells run $200–$700
Fixr's 2025 guide puts annual salt at $100–$400 versus $300–$800 in chemicals for a chlorine pool, and Bob Vila's 2024 guide gives cells a 5–7 year life. Factor the cell replacement into the payback math.
Fixr, Saltwater Pool Cost (2025)$725 The average pool repair costs $725; leak detection runs $100–$500
HomeAdvisor's 2026 repair guide lists in-ground repairs at $350–$2,700, heater repair at $160–$730, light fixtures at $65–$150 each and small concrete cracks at about $75 per linear foot. When repairs stack up, a planned remodel is often cheaper than piecemeal fixes.
HomeAdvisor, Pool Repair Cost (2026)$3,594–$10,782 An automatic pool cover costs $3,594–$10,782; a saltwater system $1,008–$2,620
Fixr's swimming pool guide itemizes the upgrades most often bundled into a remodel. Auto covers cut evaporation and heating loss while adding a safety layer, which helps justify the price on an older pool.
Fixr, Swimming Pool Cost (2024)7.6% Homes with a hot tub (2024)
7.6% of occupied primary-residence housing units in 2024 (about 10.1M housing units); by region: Northeast 5.7%, Midwest 7.1%, South 7.1%, West 10.5%. Pool Renewal Notes' weighted analysis of EIA 2024 RECS preliminary household microdata (May 2026).
Pool Renewal Notes analysis of EIA 2024 RECS preliminary household microdata (May 2026)47.7% Pool homes using the pool in all 12 months (2024)
47.7% of homes with a swimming pool in 2024 (about 4.6M housing units); by region: South 63.2%, West 76.9%. Pool Renewal Notes' weighted analysis of EIA 2024 RECS preliminary household microdata (May 2026).
Pool Renewal Notes analysis of EIA 2024 RECS preliminary household microdata (May 2026)35.8% Pool homes with a reported heating fuel (2024)
35.8% of homes with a swimming pool in 2024 (about 3.4M housing units); by region: Northeast 31.8%, South 32.0%, West 49.6%. Pool Renewal Notes' weighted analysis of EIA 2024 RECS preliminary household microdata (May 2026).
Pool Renewal Notes analysis of EIA 2024 RECS preliminary household microdata (May 2026)41.9% Pool homes using the pool in 1 to 6 months (2024)
41.9% of homes with a swimming pool in 2024 (about 4.0M housing units); by region: Northeast 94.9%, Midwest 89.2%, South 23.2%. Pool Renewal Notes' weighted analysis of EIA 2024 RECS preliminary household microdata (May 2026).
Pool Renewal Notes analysis of EIA 2024 RECS preliminary household microdata (May 2026)30.0% Hot-tub homes using the tub in all 12 months (2024)
30.0% of homes with a hot tub in 2024 (about 3.0M housing units); by region: Northeast 42.2%, Midwest 29.1%, South 22.9%, West 33.7%. Pool Renewal Notes' weighted analysis of EIA 2024 RECS preliminary household microdata (May 2026).
Pool Renewal Notes analysis of EIA 2024 RECS preliminary household microdata (May 2026)52.7% Hot-tub homes using electricity to heat the tub (2024)
52.7% of homes with a hot tub in 2024 (about 5.3M housing units); by region: Northeast 60.1%, Midwest 56.4%, South 50.1%, West 50.2%. Pool Renewal Notes' weighted analysis of EIA 2024 RECS preliminary household microdata (May 2026).
Pool Renewal Notes analysis of EIA 2024 RECS preliminary household microdata (May 2026)2.1% Homes with both a swimming pool and a hot tub (2024)
2.1% of occupied primary-residence housing units in 2024 (about 2.8M housing units); by region: Northeast 1.1%, South 2.4%, West 3.7%. Pool Renewal Notes' weighted analysis of EIA 2024 RECS preliminary household microdata (May 2026).
Pool Renewal Notes analysis of EIA 2024 RECS preliminary household microdata (May 2026)13.3% Pool homes using electric pool heating (2024)
13.3% of homes with a swimming pool in 2024 (about 1.3M housing units); by region: South 16.3%. Pool Renewal Notes' weighted analysis of EIA 2024 RECS preliminary household microdata (May 2026).
Pool Renewal Notes analysis of EIA 2024 RECS preliminary household microdata (May 2026)48.2% of U.S. pool homes report no variable-speed pump (about 4.6 million pools)
EIA's 2024 survey counts 4,629,000 pool homes still on single or dual-speed pumps. Installed stock, not sales; since the 2021 DOE rule most new residential pumps sold are variable speed, so this is the upgrade backlog.
EIA 2024 Residential Energy Consumption Survey (preliminary microdata, May 2026)60.1% of U.S. pool homes report an unheated pool
EIA's 2024 survey finds 5.77 million of 9.6 million pool homes with no heating fuel. Adding a heat pump to an unheated pool in a warm climate is a common season-extending upgrade.
EIA 2024 Residential Energy Consumption Survey (preliminary microdata, May 2026)15.8% of U.S. pool homes heat the pool with natural gas
EIA's 2024 survey shows gas as the most common pool heating fuel among the minority that heat, with electricity, which includes heat pumps, close behind. Installed stock; the mix shifts toward heat pumps as gas units are replaced in warm climates.
EIA 2024 Residential Energy Consumption Survey (preliminary microdata, May 2026)$200–$1,800 vs $800–$6,000 per year A heat pump costs $200–$1,800 a year to run versus $800–$6,000 for natural gas
Fixr's 2025 heater guide (national average $3,500) shows propane can reach $12,000 a year while solar runs $0–$120. Swapping an old gas heater for a heat pump is one of the highest-payback equipment upgrades in warm climates.
Fixr, Pool Heater Installation Cost (2025)$310 per year An old pool pump can be a home's second-largest energy user at up to $310 a year
ENERGY STAR says certified in-ground pumps use 20% less energy than the federal baseline and pay back in under two years, and cutting filter run time from 24 to 6 hours a day cuts pump energy 75%. A pump swap is the cheapest equipment upgrade with a measurable bill impact.
ENERGY STAR, Pool Pumps (2026)Up to 90% Variable-speed pumps cut pump energy up to 90%; DOE rules apply since July 2021
Pentair's DOE page cites Department of Energy estimates of about $550 a year in improved operating cost for a compliant pump and notes more than 8.5 million U.S. pools are affected. Most single-speed replacements are no longer sold new.
Pentair, Pool Pump DOE Standards (2021)July 19, 2021 Since July 19, 2021, pool pumps over 1.0 total HP must be variable speed
In The Swim's explainer says a variable-speed pump can save 40–80% on monthly pump energy depending on run schedule and plumbing resistance. Homeowners replacing a failed single-speed pump will almost always be sold a variable-speed model.
In The Swim, National Variable Speed Pool Pump Law (2021)$345–$735 per year A variable-speed pump saves about 65%, or $345–$735 a year by pool size
Pool Goods' May 2026 modeling shows a large 25,000+ gallon pool dropping from about 7,000 kWh to 2,400 kWh a year, with the pump premium paid back in 1–3 years. High-rate states like Hawaii see savings above $1,700 a year.
Pool Goods, Variable Speed Pool Pump Energy Savings by Pool Size (2026)8–12 years A pool pump lasts 8–12 years; variable-speed models save 80% or more on energy
Bob Vila's pump guide says dual-speed pumps save 50–70% and variable-speed 80%+ versus single-speed, and quiet models run in the 40-decibel range versus 65–90 for older pumps. Age plus noise are the usual signs it is time to upgrade.
Bob Vila, Best Pool Pumps (2026)73.4% of Northeastern pool homes report no variable-speed pump, the highest regional share
EIA's 2024 regional breakdown shows the Northeast with the oldest equipment base: 1.2 million of 1.64 million pool homes lack a variable-speed pump, against 62% in the Midwest, 50% in the South and 19% in the West.
EIA 2024 Residential Energy Consumption Survey (preliminary microdata, May 2026)76.95% of Western pool homes already report a variable-speed pump
EIA's 2024 survey shows the West far ahead on pump efficiency, likely reflecting California's early rules. Where the pump is already upgraded, the heater or a cover is often the next best equipment spend.
EIA 2024 Residential Energy Consumption Survey (preliminary microdata, May 2026)63.15% of Southern pool homes use the pool all 12 months
EIA's 2024 regional breakdown shows about 2.8 million Southern pool homes swimming year-round, which means twelve months of wear at the waterline and full value from heat pumps and salt systems.
EIA 2024 Residential Energy Consumption Survey (preliminary microdata, May 2026)94.88% of Northeastern pool homes use the pool 1 to 6 months a year
EIA's 2024 survey shows the Northeast's season is short: 1.56 million of 1.64 million pool homes use the pool one to six months. Finishes there face freeze-thaw and a long closing, and the work window ends before frost.
EIA 2024 Residential Energy Consumption Survey (preliminary microdata, May 2026)7.2% of occupied U.S. homes have a swimming pool (about 9.6 million households)
EIA's 2024 survey estimates 9,604,000 occupied primary residences with a pool. Installed stock, not purchases; this is the base that generates renovation demand every decade or so.
EIA 2024 Residential Energy Consumption Survey (preliminary microdata, May 2026)22% Remodel work is 22% of U.S. pool product sales; maintenance 64%, new builds 14%
Pool Corporation, the largest pool products distributor, reported the same 64/22/14 mix for 2024 and 2025. The installed base of roughly 10 million pools generates far more renovation spending than new builds do.
Pool Corporation Q4 2025 earnings call transcript (MarketBeat)49% vs 19% In Q4 2024, 49% of pool companies saw remodel revenue rise; only 19% saw it fall
PHTA's Quarterly Pulse Survey of 300+ businesses found remodeling was the strongest construction segment, well ahead of new pools (34% up, 35% down). Remodelers are busy, so book early for spring work.
Pool & Hot Tub Alliance, Q4 2024 Pulse Survey42% vs 21% In Q3 2025, 42% of pool firms reported higher remodel revenue; 21% lower
PHTA's Q3 2025 Pulse Survey found remodel demand still twice as likely to be rising as falling, and 55% of firms reported more service calls. Building and remodeling profits were flat, so expect firm pricing rather than discounts.
Pool & Hot Tub Alliance, Q3 2025 Pulse Survey71% of surveyed homeowners who hired a pro postponed a project in the past year
Angi's April 2025 pulse survey found most homeowners who hired a professional had delayed at least one project. For pool renovations it signals off-season capacity worth using.
Angi 2025 State of Home Spending Pulse Report29% of surveyed homeowners who hired a pro bundled repairs to manage cost
Angi's April 2025 pulse survey of homeowners who hired a professional found nearly a third bundling repairs. Pools are the clearest case, since every interior job shares a drain, a refill and a startup.
Angi 2025 State of Home Spending Pulse Report19% of surveyed homeowners who hired a pro chose cheaper materials or services
Angi's April 2025 pulse survey found about one in five homeowners trading down on materials to manage cost. On a resurfacing, the safe place to save is finish grade, not preparation.
Angi 2025 State of Home Spending Pulse Report62% of surveyed homeowners who hired a pro were more concerned about maintenance affordability
Angi's April 2025 pulse survey found rising concern about the cost of keeping a home up. For pool owners, equipment upgrades that cut the recurring bill address exactly that concern.
Angi 2025 State of Home Spending Pulse Report54% of surveyed Houzz homeowners renovated in 2025
The 2026 U.S. Houzz & Home Study is a platform sample of Houzz users, not all households. It shows sustained renovation activity among engaged homeowners.
2026 U.S. Houzz & Home Study47% of surveyed Houzz homeowners repaired their home in 2025
Houzz's 2026 study, a platform sample, found nearly half of surveyed homeowners doing repair work in 2025. Repair-led renovation is the norm, and pool work follows the same pattern of fixing what failed first.
2026 U.S. Houzz & Home Study50% of surveyed Houzz homeowners planned a renovation in 2026
Houzz's 2026 study reports intent among its platform sample; intent is not completed work. It indicates continued renovation demand competing for contractor capacity.
2026 U.S. Houzz & Home Study69.1% of hot-tub homes report no swimming pool
Pool Renewal Notes' weighted analysis of the EIA's 2024 household survey microdata: Hot-tub homes with a yes/no pool response: share reporting no pool 69.1%. A combined pool-and-spa package does not describe every existing hot-tub household.
Pool Renewal Notes analysis of EIA 2024 RECS household data52% Decorated in 2025 (2025 activity; 2026 plans)
The 2026 U.S. Houzz & Home Study surveyed homeowners on Houzz about their 2025 projects and 2026 plans; 52% decorated in 2025, alongside 54% who renovated and 47% who made repairs.
2026 U.S. Houzz & Home Study23% Started early before price rises (April 15-16, 2025)
Angi's 2025 Home Spending Pulse surveyed homeowners who had hired a pro in the previous year (fielded April 15–16, 2025). 23% started a project early before expected price rises.
Angi 2025 Home Spending Pulse5–10 vs 20+ years Standard plaster lasts 5–10 years; quartz 10–15; aggregate 15–20; pebble 20+
Shasta Pools' lifespan table shows a pebble finish can outlast plaster by two to four cycles. Paying roughly double up front for pebble often costs less per year of service than replastering repeatedly.
Shasta Pools, Cost to Replace Your Pool Tile, Deck or Interior Finish (2026)3 days vs 11 days Replastering typically takes 3 days; a complete pool upgrade averages 11 days
CostHelper's figures are user-reported and the page gives no data date, so this site uses them for working days only, not prices. The days are on-site work; draining, refill and the startup cure add to the time the pool is out of service.
CostHelper, Pool Resurfacing Cost (2026)10–14 calendar days A pool resurfacing takes 10–14 calendar days from drain to swimming
D&J The Pool Resurfacers, an Orlando contractor, breaks it down as 6–12 hours to drain, three to five days of prep and repairs, application, 12–48 hours to refill and about a week after filling before swimming, with brushing once or twice a day.
D&J The Pool Resurfacers, How Long Does Pool Resurfacing Take? (2026)5–8% A pool in good condition adds about 5–8% to home value, 10–15% in the Sun Belt
Opendoor's May 2026 analysis also estimates routine pool maintenance at $3,000–$5,000 a year and major repairs at $5,000–$15,000 per event. Keeping the pool in saleable condition protects a five-figure slice of home equity.
Opendoor, Does a Pool Add Value to Your Home (2026)Over 70% of fatal child pool/spa drownings in 2021–2023 happened at a residence
CPSC's June 2026 report counted an average of 376 child deaths a year, 379 in 2023 alone, with nearly 80% under age five. A remodel is the natural time to add compliant drain covers, a self-closing gate, alarms or a safety cover.
U.S. Consumer Product Safety Commission, 2026 drowning report releaseDecember 19, 2008 The Virginia Graeme Baker Pool & Spa Safety Act took effect December 19, 2008
Signed December 19, 2007, the federal law targets drain entrapment and requires compliant anti-entrapment drain covers on public pools; the same covers are the standard for residential equipment upgrades. Replacing an old flat drain cover during a remodel is inexpensive insurance.
CPSC Pool Safely, Pool & Spa Safety Act (2008)$960–$1,800 per year Pool upkeep costs $960–$1,800 a year, with pump electricity up to $300
HomeAdvisor's 2026 guide puts professional cleaning at $80–$150 a month and seasonal opening or closing at $150–$300 each. Renovations that add a variable-speed pump, saltwater or automation lower this recurring number.
HomeAdvisor, Pool Maintenance Cost (2026)Homes with a swimming pool: 7.2% nationally. Highest in Florida (19.9%), Arizona (18.9%), Nevada (11.8%); lowest in Maryland (3%), Illinois (3.5%), Hawaii (3.6%).
Homes with a hot tub: 7.6% nationally. Highest in Washington (12.6%), Nevada (12.3%), Montana (12.2%); lowest in Kentucky (3.5%), Massachusetts (4.1%), New York (4.9%).
Pool Renewal Notes calculated these state estimates from the Energy Information Administration's 2024 household survey microdata. EIA publishes the 2024 survey nationally and by region, not by state. Shares are weighted; a dash means the state sample was too small for a reliable estimate (fewer than 100 households, fewer than 10 yes answers, or a relative standard error above 30%). Source data.
| State | Homes with a swimming pool | Homes with a hot tub |
|---|---|---|
| United States | 7.2% | 7.6% |
| Alabama | 5% | 5.7% |
| Alaska | — | 11% |
| Arizona | 18.9% | 11.8% |
| Arkansas | — | — |
| California | 9.8% | 10.8% |
| Colorado | — | 7.1% |
| Connecticut | 9.8% | 5.9% |
| Delaware | — | 9.1% |
| District of Columbia | — | — |
| Florida | 19.9% | 10% |
| Georgia | 6% | 5.8% |
| Hawaii | 3.6% | — |
| Idaho | — | 9.4% |
| Illinois | 3.5% | 9% |
| Indiana | 5.6% | 5.9% |
| Iowa | — | 5.7% |
| Kansas | — | 7.1% |
| Kentucky | 9.4% | 3.5% |
| Louisiana | 9.5% | 6.5% |
| Maine | 5.1% | 5.6% |
| Maryland | 3% | 8.6% |
| Massachusetts | 5.8% | 4.1% |
| Michigan | 5.2% | 6.5% |
| Minnesota | — | 8.7% |
| Mississippi | 5.3% | 6.5% |
| Missouri | — | 6% |
| Montana | — | 12.2% |
| Nebraska | — | 6.3% |
| Nevada | 11.8% | 12.3% |
| New Hampshire | 8.3% | 7.1% |
| New Jersey | 8.4% | 7.9% |
| New Mexico | — | 6.5% |
| New York | 7.2% | 4.9% |
| North Carolina | 4.7% | 5.5% |
| North Dakota | — | 8.2% |
| Ohio | 7.6% | 6.7% |
| Oklahoma | 7.3% | 8.6% |
| Oregon | — | 9.9% |
| Pennsylvania | 6.2% | 5.8% |
| Rhode Island | 8.7% | 5.8% |
| South Carolina | 7.4% | 8.2% |
| South Dakota | — | 8.6% |
| Tennessee | 6.8% | 6.9% |
| Texas | 8.1% | 7.1% |
| Utah | — | 11.7% |
| Vermont | 8% | — |
| Virginia | — | 5.8% |
| Washington | — | 12.6% |
| West Virginia | — | — |
| Wisconsin | — | — |
| Wyoming | — | 9% |
How many existing homes already have the features that shape a pool renovation project, nationally and in each census region. Pool Renewal Notes weighted these from the federal survey records; counts are rounded.
| Measure | U.S. | Northeast | Midwest | South | West | Source |
|---|---|---|---|---|---|---|
| Homes with a swimming pool2024 · occupied primary-residence housing units | 7.2% | 7.2% | 4.4% | 8.6% | 7.6% | U.S. Energy Information Administration |
| Homes with a hot tub2024 · occupied primary-residence housing units | 7.6% | 5.7% | 7.1% | 7.1% | 10.5% | U.S. Energy Information Administration |
| Pool homes reporting a variable-speed pump2024 · homes with a swimming pool | 47.7% | 21.5% | — | 46.8% | 76.9% | U.S. Energy Information Administration |
| Pool homes reporting no variable-speed pump2024 · homes with a swimming pool | 48.2% | 73.4% | 61.8% | 50.0% | 18.8% | U.S. Energy Information Administration |
| Pool homes with a reported heating fuel2024 · homes with a swimming pool | 35.8% | 31.8% | — | 31.9% | 49.6% | U.S. Energy Information Administration |
| Pool homes reporting an unheated pool2024 · homes with a swimming pool | 60.1% | 63.1% | 64.3% | 64.8% | 46.1% | U.S. Energy Information Administration |
| Pool homes using the pool in all 12 months2024 · homes with a swimming pool | 47.7% | — | — | 63.2% | 76.9% | U.S. Energy Information Administration |
| Pool homes using the pool in 1 to 6 months2024 · homes with a swimming pool | 41.9% | 94.8% | 89.2% | 23.2% | — | U.S. Energy Information Administration |
| Hot-tub homes using the tub in all 12 months2024 · homes with a hot tub | 30.0% | 42.2% | 29.0% | 22.9% | 33.7% | U.S. Energy Information Administration |
| Hot-tub homes using electricity to heat the tub2024 · homes with a hot tub | 52.7% | 60.1% | 56.4% | 50.1% | 50.2% | U.S. Energy Information Administration |
| Homes with both a swimming pool and a hot tub2024 · occupied primary-residence housing units | 2.1% | 1.1% | — | 2.4% | 3.7% | U.S. Energy Information Administration |
| Pool homes using electric pool heating2024 · homes with a swimming pool | 13.3% | — | — | 16.3% | — | U.S. Energy Information Administration |
| Pool homes using natural-gas pool heating2024 · homes with a swimming pool | 15.8% | — | — | 11.6% | 27.7% | U.S. Energy Information Administration |
Published figures come from Angi, EIA 2024 Residential Energy Consumption Survey, Angi 2025 State of Home Spending Pulse Report, 2026 U.S. Houzz & Home Study, HomeAdvisor, Shasta Pools, CostHelper, Swimply and other named sources, each linked where it appears. Housing data by region is Pool Renewal Notes's weighted tabulation of the EIA's 2024 Residential Energy Consumption Survey public microdata, using the survey's own weights and 60 replicate weights for the intervals, and of the Census Bureau's Characteristics of New Housing tables. Figures describe the period and population shown next to each one.
Homeowner polls
The symptom decides which scope to price first.
No votes yet. Yours will be the first. · saved on this device
No votes yet. Yours will be the first. · saved on this device
No votes yet. Yours will be the first. · saved on this device
7.2% nationally in 2024 (about 9.6M housing units), based on Pool Renewal Notes' weighted analysis of EIA 2024 RECS preliminary household microdata (May 2026). The share is highest in the South at 8.6% and lowest in the Midwest at 4.4%. The figure covers occupied primary-residence housing units.
7.6% nationally in 2024 (about 10.1M housing units), based on Pool Renewal Notes' weighted analysis of EIA 2024 RECS preliminary household microdata (May 2026). The share is highest in the West at 10.5% and lowest in the Northeast at 5.7%. The figure covers occupied primary-residence housing units.
47.7% nationally in 2024 (about 4.6M housing units), based on Pool Renewal Notes' weighted analysis of EIA 2024 RECS preliminary household microdata (May 2026). The share is highest in the West at 76.9% and lowest in the Northeast at 21.5%. The figure covers homes with a swimming pool.
48.2% nationally in 2024 (about 4.6M housing units), based on Pool Renewal Notes' weighted analysis of EIA 2024 RECS preliminary household microdata (May 2026). The share is highest in the Northeast at 73.4% and lowest in the West at 18.8%. The figure covers homes with a swimming pool.
35.8% nationally in 2024 (about 3.4M housing units), based on Pool Renewal Notes' weighted analysis of EIA 2024 RECS preliminary household microdata (May 2026). The share is highest in the West at 49.6% and lowest in the Northeast at 31.8%. The figure covers homes with a swimming pool.
Most hot tubs sit on their own, not beside a pool. A stand-alone spa pad with its own electrical run is the common project, and it doesn't need to be priced as a pool package. Pool Renewal Notes calculated this from the federal government's 2024 household survey data: hot-tub homes with a yes/no pool response: share reporting no pool 69.1%.
$10,482. Angi's cost guide, updated August 2026, is the benchmark behind this site. It is a broad range that mixes project sizes and repair scopes; a new surface, structural repair or reshaped pool needs its own diagnosis and quote. Source: Angi, Pool Remodel Cost (2026).
29%. Angi's April 2025 pulse survey of homeowners who hired a professional found nearly a third bundling repairs. Pools are the clearest case, since every interior job shares a drain, a refill and a startup. Source: Angi 2025 State of Home Spending Pulse Report.
 Free toolPool resurfacing and renovation cost calculator
Size, material tier and complexity in, a realistic budget range out.
 Free toolRenovation comparisons, decided by your pool's condition
Side-by-side tables for the decisions that change the price most.
 Free toolPool renovation quiz: nine facts to know before the first proposal
9 questions that show what you already know and what to check next.
 Free toolPool renovation polls
See what other planners chose and add your vote.
 Service guidePool Resurfacing
Pool resurfacing replaces a worn interior finish on a concrete pool with new plaster, quartz, pebble aggregate or tile, or replaces the liner on a vinyl pool.
 Service guideTile & Coping Replacement
Tile and coping replacement renews the waterline band and the edge cap on the bond beam after the cause of the failure is understood.
 Service guideEquipment Upgrades
Equipment upgrades replace or add the pump, filter, heater, sanitizer, lights, automation and safety hardware on an existing pool.
 Service guideComplete Pool Remodel
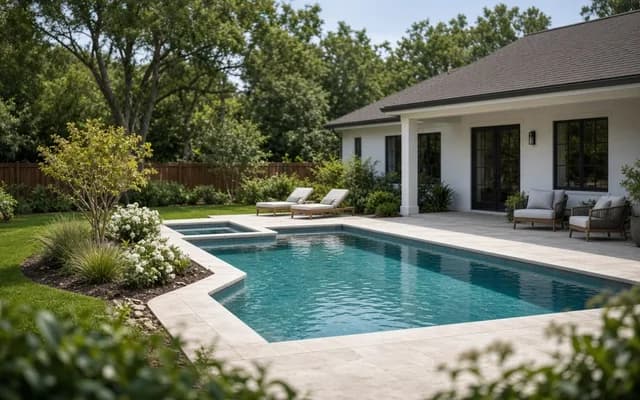
A complete pool remodel coordinates several diagnosed repairs and desired changes, typically interior finish, tile and coping, deck, equipment and features, into one sequence with one drain cycle and one contractor accountable.
Tell us the size, the condition of what is there now, and what you want to change. Pool Renewal Notes passes your request to independent local professionals, who reply with written, no-obligation estimates. The service is free to use.